Scraping and Analysing Indeed Job Data
Have you ever been looking at the job market, and wanted better information? Wanted to know more about the number of jobs being advertised and the companies advertising. But you do not want to have to gather all the data manually. Being a data analyst gives me the skills and tools to attain the data and answer such questions. So today I am going to show how it can be done using Python.
I have selected indeed.com as it is the largest job website in the world, boasting over 250 million monthly users with nearly 10 new job listings added every second. A quick look at the site and I could see that it has an API; but as I was after a relatively small amount of data I decided to scrape the data instead.
The process was broken down into two parts, first I wrote a python script for scraping indeed.com, second I produced a notebook for analysing the data.
My go to language is Python, due to its fast development time, large selection of libraries and excellent community.
Scraping indeed.com
First I needed to decide what I wanted to scrape, my personal focus is on data so for this I will search ‘Data analysis’ and ‘data science’. I decided to scrape new jobs posted in the last week. With this in hand I created a base URL as shown below and concatenated other search strings for job, location and timeframe.
job = "data+science+analyst"
Location = "London"
last_x_days = "7"
base_url = "https://uk.indeed.com/jobs?q="+job+"&l="+Location+"&fromage="+last_x_days
This allows me to cycle through pages using a while loop. I used Requests to return the pages and BeautifulSoup to process the HTML, it provides a user-friendly API to grab the data. I then wrote a number of functions, one to for each of the data points I wanted to grab from indeed. These included:
- job title
- company name
- company location
- salary
- date added to indeed
- page number
- total count of jobs
Here is the function to get the company location, you can see that I had to remove the last item from the list as it consistently ended with a blank item.
def company_location(soup):
    """Func to get the company location"""
    data_str = ""
    result = ""
    for item in soup.find_all(class_="companyLocation"):
        # build a string adding the new data each loop
        data_str = data_str + item.get_text() + "\n"
    # split the string and make a list
    result = data_str.split("\n")
    # remove unwanted last item
    result.pop()
    return result
Job id
I had hoped to be able to pull a unique job id from indeed. But the id seems to be dynamic and changes each load of the page. So I will have to deal with potential duplicates while analysing until I find a better solution.
Reshape data
I wanted to push the data to a pandas DataFrame to make it easy to output ready for analysis. So the data needed to be transformed from a list of lists, the current data structure, to a DataFrame.
From this:-
[['Data Analyst', 'Data Analyst', 'Data Analyst', 'Genome Analyst / Data Scientist', 'Graduate Data Science and Econometric Analyst'],
['Burberry', 'NonStop Consulting', 'Ladder.io', 'Genomics England'],
['London', 'Remote in London', 'London', 'Hybrid remote in London', 'United Kingdom'],
['No Salary provided', 'No Salary provided', 'No Salary provided', 'No Salary provided', '£42,000 - £45,000 a year'],
[datetime.date(2022, 4, 8), datetime.date(2022, 4, 6), datetime.date(2022, 4, 12), datetime.date(2022, 4, 12), datetime.date(2022, 4, 6)]]
To this:-
| # | job_title | company_name | company_location | salary | date_added |
|---|---|---|---|---|---|
| 0 | Data Analyst | Burberry | London | No Salary provided | 2022-04-08 |
| 1 | Data Analyst | NonStop Consulting | Remote in London | No Salary provided | 2022-04-06 |
| 2 | Data Analyst | Ladder.io | London | No Salary provided | 2022-04-12 |
| 3 | Genome Analyst / Data Scientist | Genomics England | Hybrid remote in London | No Salary provided | 2022-04-12 |
| 4 | Graduate Data Science and Econometric Analyst | Graduate Recruitment Bureau | United Kingdom | £42,000 - £45,000 a year | 2022-04-06 |
Each list has one column rather than one row of data. So we need to transpose that which was achieved using map and zip. Zip takes iterables and combines them in a tuple. Map is used to execute a function on iterables. The resulting list can then be used to produce a DataFrame. A DataFrame is a matrix style data structure similar to a spreadsheet with rows and columns.
# transpose list of lists so it fits into a df
l = list(map(list, zip(*l)))
df = pd.DataFrame(l, columns=['job_title', 'company_name', 'company_location', 'salary', 'date_added'])
Enriching the data (feature engineering)
Before outputting the data, I wanted two extra fields added, the first was job category. This would help when it came to analysis by grouping the jobs into a small number of familiar titles. I wrote the below function to help with this and then used pandas apply to run on the job_title field. I will be adding extra category’s in the future but for now there are three: Data Analyst, Data Scientist, and Data Engineer.
def map_to_job_category(x):
    """Func to map job Category if job title contains string"""
    cat_map = {'Analyst': 'Data Analyst',
               'Scientist': 'Data Scientist',
               'Data Science': 'Data Scientist',
               'Engineer': 'Data Engineer'}

    group = "unknown"
    for key in cat_map:
        if key in x:
            group = cat_map[key]
            break
    return group
Saving data
I pushed the data into a pandas DataFrame and originally output the data to a CSV file. But a database is better long term so I took advantage of the fact Python is packaged with sqlite3 a self-contained, full-featured SQL database. It is very easy to setup an sqlite DB, just import then create a connection object and execute the SQL.
import sqlite3
conn = sqlite3.connect(r'filename.db')
conn.execute('''CREATE TABLE IF NOT EXISTS JOBS
                (job_title TEXT,
                company_name TEXT,
                company_location TEXT,
                salary TEXT,
                date_added DATE,
                date_scrapped DATETIME,
                job_category TEXT
                )''')
The full code for this script can be found here job_data_analysis
Analysis of jobs data
The second stage to this task involved using a notebook (.ipynb file). Notebooks help create reproducible, shareable, collaborative computational narratives. If you have not worked with Jupyter notebooks read here on their history. Notebooks have become an important tool for data science and while they have issues e.g. lack of debugger. They are still the best way to analyse data with Python but are no longer restricted to Python you can write R and a number of other languages in notebooks.
After importing the data from the DB, first thing was to clean and enrich the data. I extracted the year/hour from the salary column and produced a salary time field. This could then be used to define between yearly and hourly pay. Note the use of the flags parameter, this is due to the fact there is no case parameter in Pandas when using str.extract.
df_DB['salary_time'] = df_DB['salary'].str.extract('(year|hour)', flags=re.IGNORECASE)
I made min and max salary fields using the salary range.
A new dataframe called sal_df was made using the following code.
sal_df = (df_DB['salary'].str.findall(r'(?:£)(\d+[,.]\d+)')
            .apply(pd.Series)
            .replace('[,.]', '', regex=True)
            .rename({0:'sal_min', 1:'sal_max'}, axis=1))
I then made an average salary field using the logic that, if there was no max salary, rather than averaging, just use the minimum salary. This is because some jobs advertise a range e.g. 40-50k and others just give a single figure e.g. 40k.
Merging the two dataframes
After checking the data I then merged the frames with a simple concat using axis=1.
Time to analyse the data
I then put together a range of visualisations using the handy plot method that comes with Pandas.
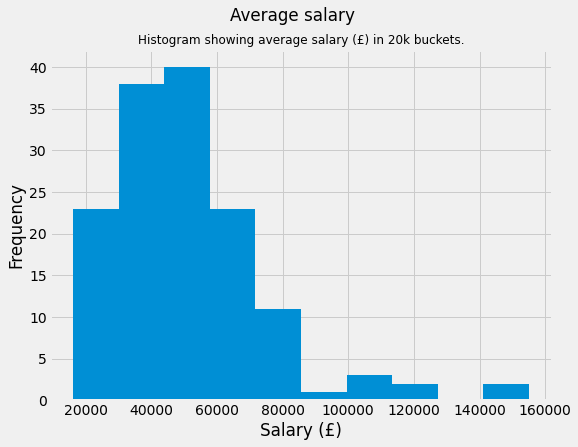
Descriptive statistics for the average salary.
It is always good to have a look at the descriptive statistics. When looking at wages many believe it is best practice to use the 50 percentile (median) rather than the mean. This is due to the robust nature of median. But for this analysis I have decided to just use mean.
| ave_salary | |
|---|---|
| count | 143.0 |
| mean | 51781.0 |
| std | 23618.0 |
| min | 16260.0 |
| 25% | 36403.0 |
| 50% | 47450.0 |
| 75% | 62000.0 |
| max | 155000.0 |
Highest salaries
I pulled the highest salaries.
| company_name | job_title | ave_salary | |
|---|---|---|---|
| 569 | Digital Waffle | Principle Data Analytics Consultant | 155000.0 |
| 438 | Digital Waffle | Principle Data Analytics Consultant | 155000.0 |
| 256 | Oliver James Associates | Senior Data Solution Architect | 125000.0 |
| 251 | BCT Resourcing | Senior Data Solution Architect | 125000.0 |
| 727 | Client Server | Software Developer C# .Net Core Data Cloud | 110000.0 |
| 247 | La Fosse Associates | Lead Data Engineer | 105000.0 |
| 721 | Technical Resources Ltd | Senior/Principal Data Engineer GCP | 100000.0 |
| 208 | Intellectual Property Office | Director of the Intellectual Property Framework | 94400.0 |
| 695 | Taylor Root Global Legal Recruitment | Model Validation Manager | 85000.0 |
| 120 | LexisNexis Risk Solutions Group | Software Engineering Lead ICIS Sutton | 82500.0 |
Lowest salaries
df_final.query("ave_salary > 0").filter(['company_name', 'job_title', 'ave_salary']).sort_values(by='ave_salary', ascending=True).head(10)
| company_name | job_title | ave_salary | |
|---|---|---|---|
| 353 | The Institute of Cancer Research | Student Placement - Clinical Trial Assistant (… | 16260.0 |
| 89 | Cathcart Associates Graduate Database | Support Analyst | 21000.0 |
| 127 | HeadStart Speech & Behaviour Therapies | ABA Tutor - Autism | 21710.0 |
| 711 | Client Server | IT Support / Operations Analyst SQL - E-commerce | 22000.0 |
| 28 | The Monarch Partnership Limited | Junior Pricing Analyst | 23000.0 |
| 408 | TalentPool | Business Insight Analyst | 23000.0 |
| 673 | Graduate Recruitment Bureau | Graduate German Speaking Digital Marketing Ana… | 24000.0 |
| 565 | I.T. Associates Ltd | Junior Procim Support/Business Analyst – 23 to… | 25500.0 |
| 159 | Department for Transport | Analysis Officer | 26126.0 |
| 504 | Natural England | Earth Observation Analyst | 26224.0 |
Job title
I looked at most used job titles. One problem while trying to compare jobs is that companies do not always use the standard job titles. They prefer to use very specific job titles which are harder to compare like for like. In future I might look at using ML to try and cluster jobs based on the wording in the advert. But for now we will stick with the job_title and job_category fields.
Data Analyst              29
Senior Data Analyst       15
Data Scientist            14
Data Engineer             12
Business Analyst           9
Senior Analyst             6
Product Analyst            6
Senior Insight Analyst     5
Quantitative Analyst       5
Analyst                    5
Name: job_title, dtype: int64
Looking at data using the job_category field
Looking at the current data captured there is a lack of salaries given; only about 25% of jobs advertise salaries which seems low to me. Of the current data scientists jobs scraped none have a salary advertised.
Here is salaries by job category.
| job_category | ave_salary | ave_salary | job_title |
|---|---|---|---|
| mean | count | count | |
| Data Analyst | 41204.0 | 40 | 192 |
| Data Engineer | 65602.0 | 3 | 21 |
| Data Scientist | 0 | 7 | |
| unknown | 72191.8 | 20 | 94 |
I will develop this analysis in the future if there is a requirement. I am thinking to pull technical requirements, and years of experience data. Hope you have enjoyed the read.