Visualising and Analysing File Structures
Recently I had a business requirement to visualise a network file structure as part of an analysis. File strutures can be very important utilities within a business, used by hundreds or maybe thousands of users each day. Maybe hosted on a on premises server or these days more likely in the cloud. While search is increasingly used to find files and the cloud has changed things somewhat. There is still need for a well structured file system in many business settings. While the IT department might have overall responsibility they do not specify the structure, that is the businesses job.
I was to look at a network drive windows file system, and analyse to see if over time inconsistencies in the structure had crept in. I wanted to be able to visualise this in a way that could give a view of strutures, names and also show file size or frequency. There are a number of ways to visualise a tree structure using python, one good resource is this page. But for me I decided to use Plotly’s sunburst visualisation. Below I will walk you through how I did this. I have made a dummy file structure for this example which contains some 40 folders and 42 files but this technique can work with thousands of folders.
Imports
I need a number of libraries to complete this task. I will use plotly for visualisation, folderstats for pulling the data, also Pandas which is the main data analysis library for python.
import folderstats
import plotly.express as px
import pandas as pd
import numpy as np
from pathlib import Path
import matplotlib.pyplot as plt
plt.style.use('fivethirtyeight')
pd.set_option('display.float_format', lambda x: '%.2f' % x)
I used folderstats to pull the file structure, note this will be slow with large file strutures. For me it took about a hour to pull 300,000 folders/files and their details. In future I would look for a way of speeding up this process. For now this worked and once pulled I saved the dataframe to a csv file for analysis. Here is how you run folderstats:
path = r'Z:\the_path'
df = folderstats.folderstats(path, ignore_hidden=True)
The output is a dataframe with these fields.
- id
- path
- name
- extension
- size
- atime
- mtime
- ctime
- folder
- num_files
- depth
- parent
- uid
Checking and enriching data
After doing some basic checking of the data, looking at n/a’s and data types etc. I then moved on to enrich the data. One problem the business had come across was long folder/files names pushing 256 characters. So I used str.len() one of Pandas vectorized string functions in the below code to add a new field called path_length.
# add length of path field
df_new['path_length'] = df_new['path'].str.len()
Checking the file path using pathlib
With the path I was working with different levels of the path structure had meaning to the business so I want to be able to extract this data. The best tool for this job is the pathlib library (in Python 3.4 and above), I tend to just import the Path class. Here are some of the useful methods.
# Make a path object
p = Path('Z:\\level1\\level2\\level3\\level4\\level5\\A_file_name')

# Get the filepath without the file name
str(p.parent)

# Get the file name
p.name

# Get the file suffix
p.suffix

# Very handy way to be able ot access any part of the path. parts makes a list so you can just use list index to grab wha you need.
p.parts[6]
# ('Z:\\',
#  'level1',
#  'level2',
#  'level3',
#  'level4',
#  'level5',
#  'A_file_name')

# Get a relative path
p.relative_to('Z:\\level1')

# Check if path exists
p.exists()
Extracting categorical data from paths
The business had provided some categorical data that they add to folder/file names. These were common names, terms and simplified dates. I want to be able to extract this data from the paths, if present, and add to a new series. For my example here I will just used year. Now there are other ways to do this using regex but for me this worked well as I had the lists of categorical data in hand.
searchfor = [
    '2014',
    '2015',
    '2016',
    '2017',
    '2018',
    '2019',
    '2020',
    '2021'
]

df_new['year'] = df_new['path'].str.extract("(" + '|'.join(searchfor) + ")")
A quick check of the output
One way to have a quick visual check of the output, if you want to compare two fields is to use Pandas sample which you call on a DataFrame. Sample does as its name suggests, samples the dataset, it is a good alternative to head or tail. The below code restricts to the two fields and returns a sample. Adding the values attribute can make it easier to view.
df_new.sample(5)[['path', 'year']].values
Below is an example of what the output looks like.
array([['..\\file_structure\\folder1\\folder3\\aa\\test_doc.docx', nan],
       ['..\\file_structure\\folder3\\folder2\\test_doc - Copy - Copy 2017.pdf', '2017'],
       ['..\\file_structure\\folder3\\folder2', nan],
       ['..\\file_structure\\folder3\\folder1\\2016', '2016'],
       ['..\\file_structure\\folder1\\folder2\\cc 2019', '2019']], dtype=object)
You will note that not all of the files/folders within my dummy structure had a year, so some nan’s (not a number) are returned. NaN is one of the ways that Pandas represents missing data.
Analyse the data
Make list of top 100 longest folder paths
One requirement as I mentioned above was to target excessively long folder paths. Long paths can cause problems with older software that has a path length limit. A list of long paths would give management a chance to talk with their team, give training, and prevent future issues. This task is made easy using pandas query and filter functions. I used the path_length field that I produced earlier in this script. Folderstats makes it very easy to focus on folders by filtering on TRUEs in the folder field.
longest_drive_paths = (df_new.sort_values(by='path_length', ascending=False)
                                    .query("folder == True")
                                    .filter(['path', 'path_length', 'folder', 'depth', 'subject'])
                                    .nlargest(100, columns='path_length'))
| # | path | path_length | folder | depth | subject |
|---|---|---|---|---|---|
| 14 | Z:path… | 184 | True | 3 | folder1 |
| 10 | Z:path… | 177 | True | 3 | folder1 |
| 1 | Z:path… | 172 | True | 3 | folder1 |
| 42 | Z:path… | 147 | True | 3 | folder3 |
| 48 | Z:path… | 147 | True | 3 | folder3 |
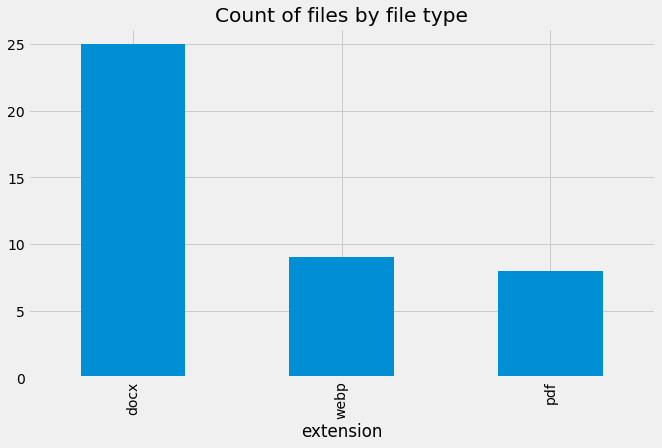
File count by extension (file type)
(df_new.groupby(['extension'])['id']
    .count()
    .sort_values()
    .nlargest(20)
    .plot.bar(title='Count of files by file type', figsize=(10,6)))
Using plotlys sunburst chart
This example is pulled from the Plotly docs to give an idea of how it works when passing a DataFrame. path is a list of columns that could be strings, floats or integers. values is a numerical column. It is as simple as that.
import plotly.express as px
df = px.data.tips()
fig = px.sunburst(df, path=['day', 'time', 'sex'], values='total_bill')
fig.show()

Get count of files extensions
Lets have a look at the file extensions.
(df_new.query("extension.notna()")
        .filter(['extension'])
        .value_counts(dropna=False))
extension
docx         25
webp          9
pdf           8
dtype: int64
Folders vs Files
Lets get a count of the files/folders.
df_new['folder'].value_counts(dropna=False)
False    42
True     41
Name: folder, dtype: int64
Comparing file paths
To compare file paths, I started by splitting the ‘path’ field to a separate DataFrame.
Split the ‘paths’ and make new df with all the paths
Using Pandas split method we can select what delimiter to split by. In this situation I wanted to split by a backslash. So two backslashes are needed so as to escape the second.
paths_df = df_new['path'].str.split("\\", expand=True).add_prefix('level_')
Looking at a sample of the new DataFrame
paths_df[['level_8', 'level_9', 'level_10', 'level_11', 'level_12']].sample(10).values
output
array([['file_structure', 'folder1', 'folder2', 'aa 2020',
        'test_doc - Copy - Copy.docx'],
       ['file_structure', 'folder1', 'folder2',
        'dd this is a long folder name also - Copy', None],
       ['file_structure', 'folder2', 'folder3', 'bb', None]], dtype=object)
Visualise new paths df
I then used the sunburst visualisation to view the paths DataFrame.
fig = px.sunburst(paths_df[['level_9', 'level_10', 'level_11', 'level_12']].dropna(),
                    path=['level_9', 'level_10', 'level_11', 'level_12'],
                    width=1000,
                    height=1000,
                    title="Four levels of folder paths, helping to visualise quality and size.")
fig.show()
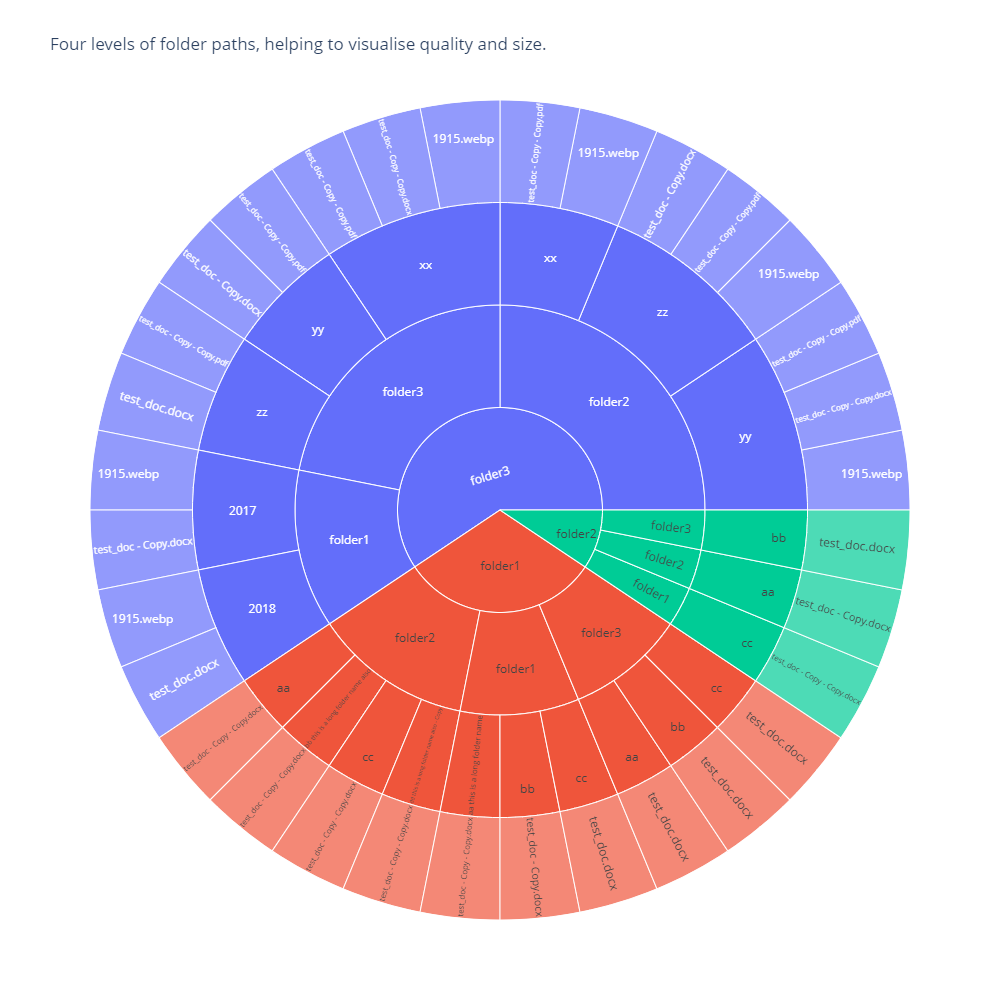
This can work with a much larger folder structure of about 5,000 folders. But you will not be able to read all folder names unless you increase the output image size. If the folder structure is to large you just wont be able to read the output. I hope you found this useful.